Data & Reporting
HR Insights & Analytics
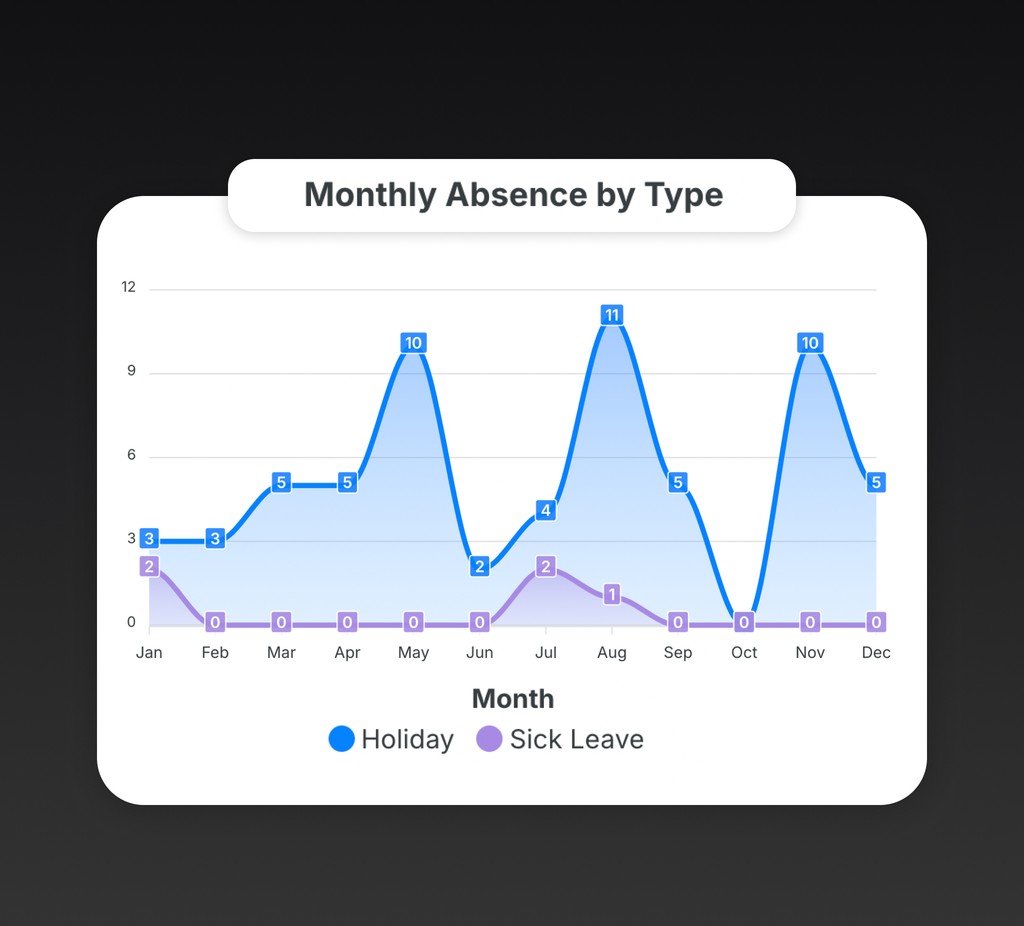
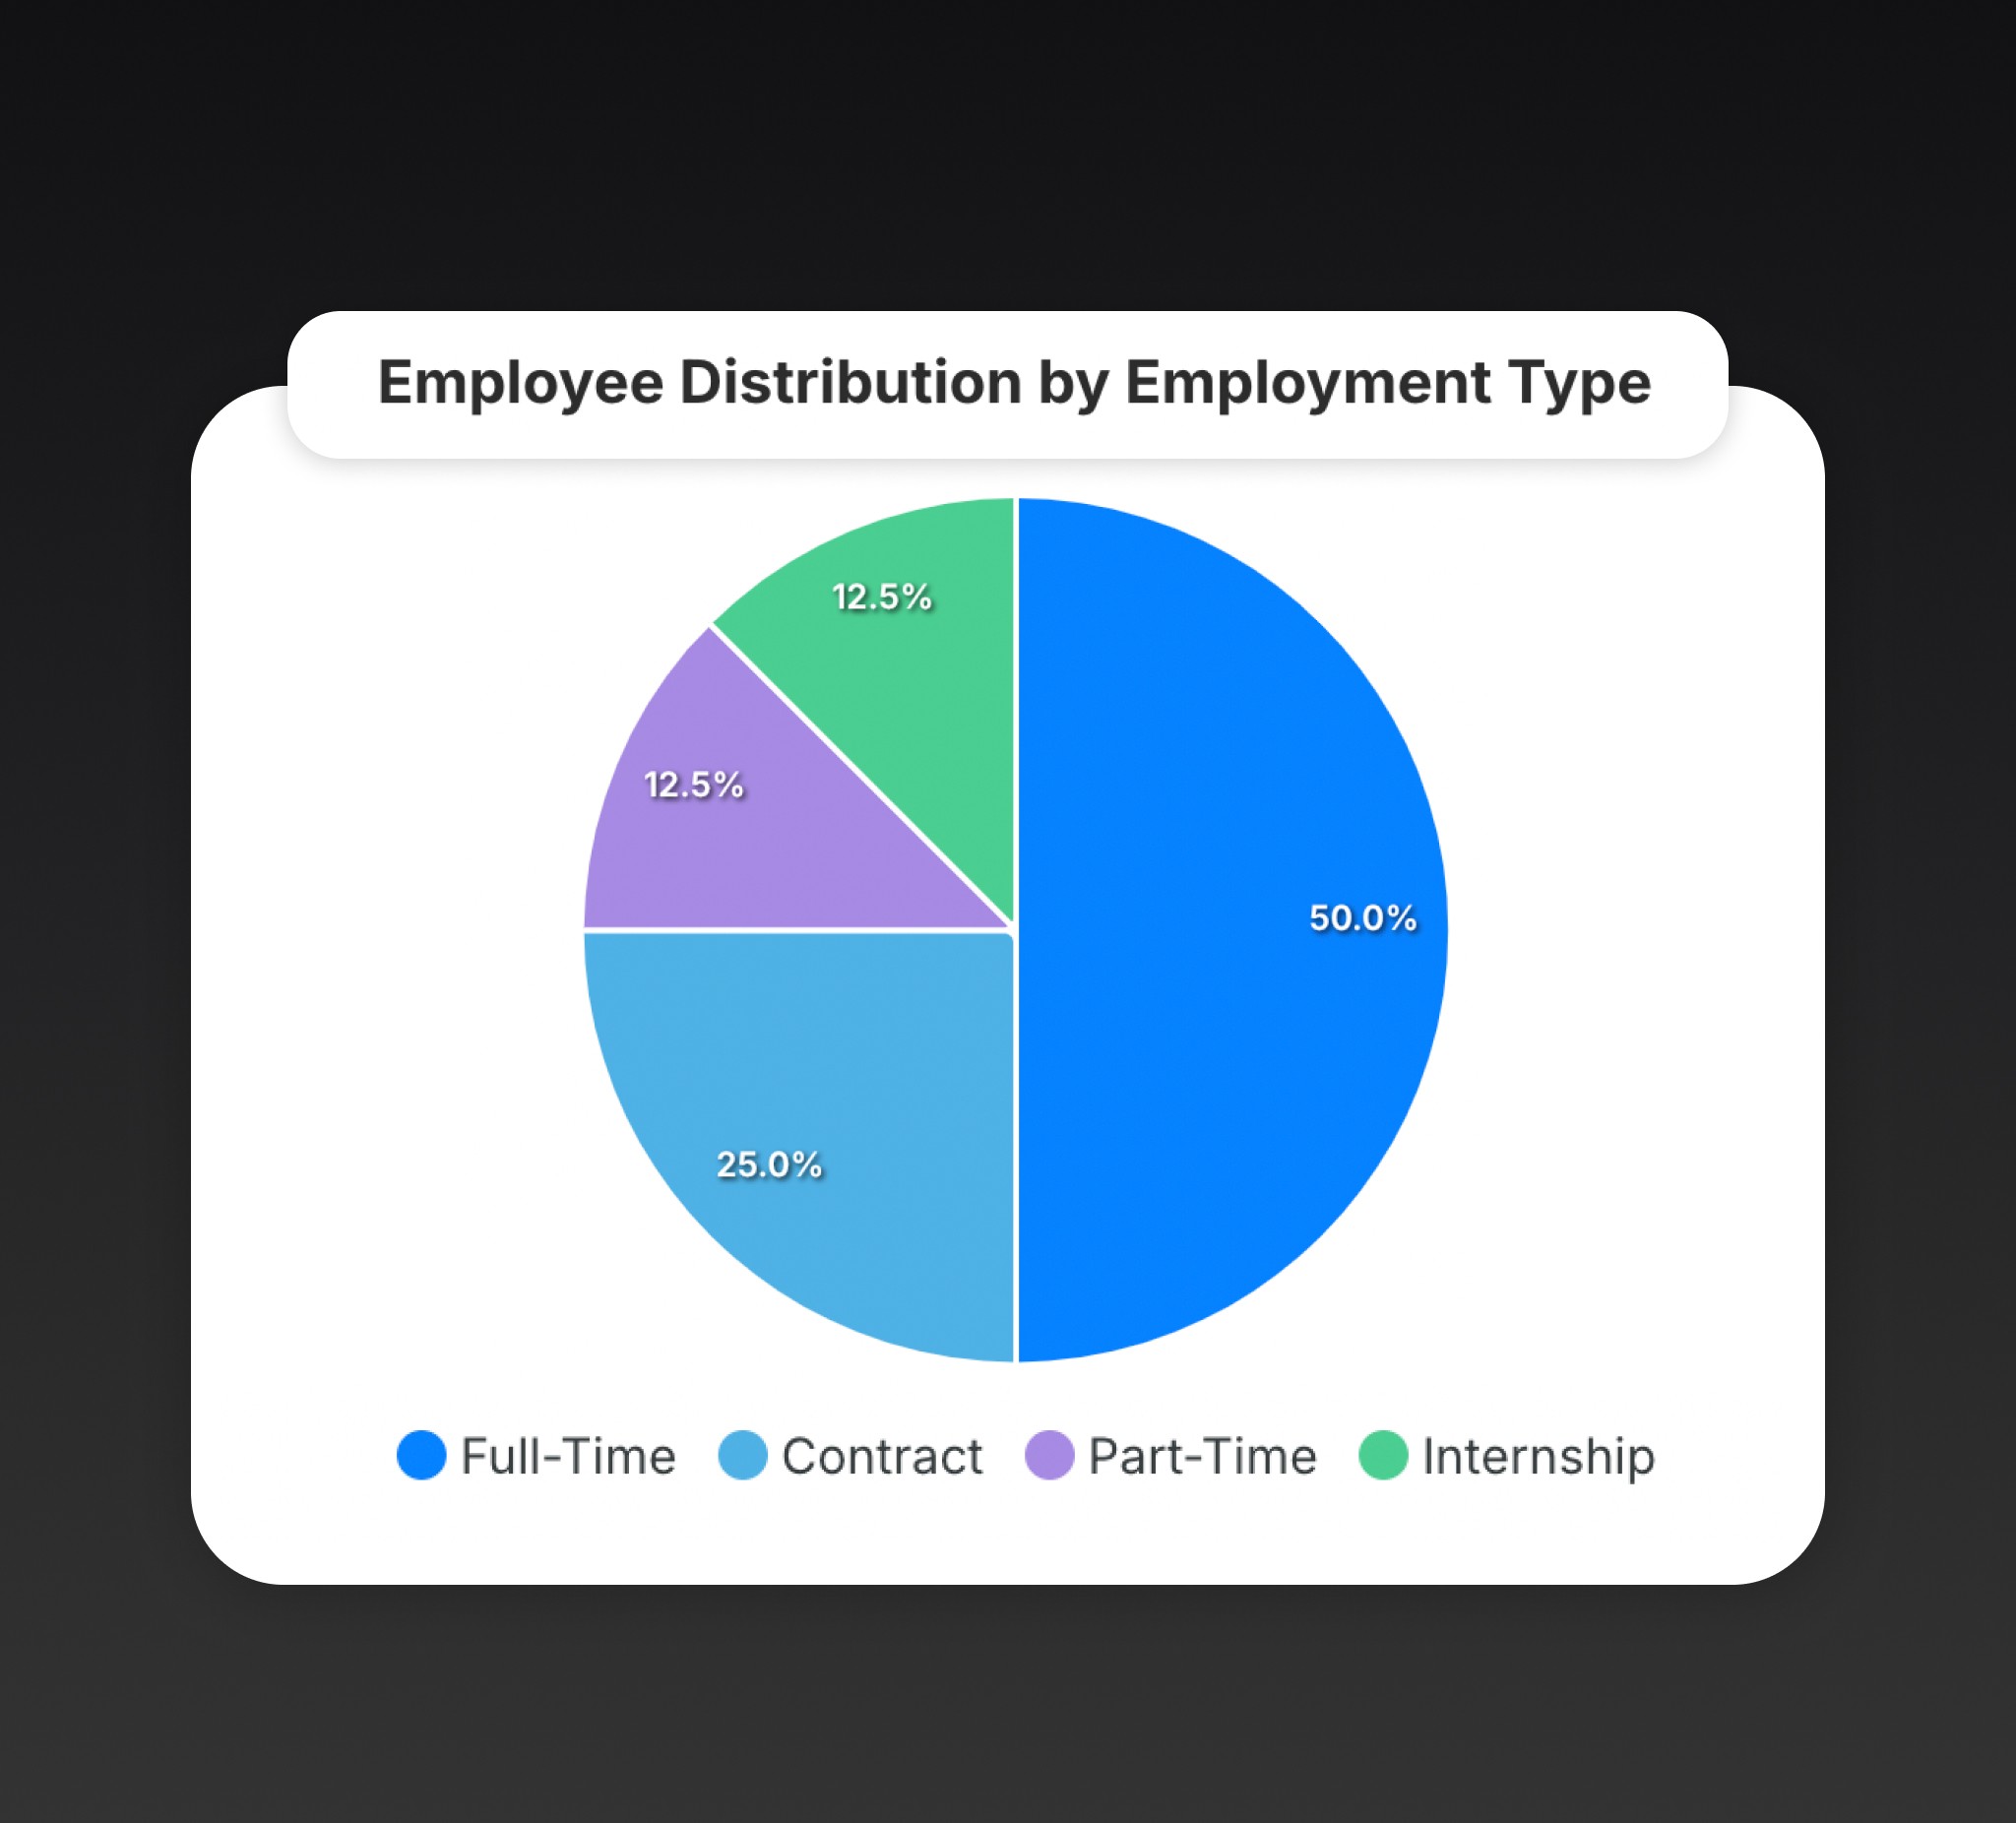
Easy access to automated charts to help visualise insights & trends to make data driven decisions
Easy access to automated charts to help visualise insights & trends to make data driven decisions
Easy access to automated charts to help visualise insights & trends to make data driven decisions
Easy access to automated charts to help visualise insights & trends to make data driven decisions


Visualize insights with instant charts
Visualize insights with instant charts
Empower your decisions with data with Adapt HRs automated charts & reports, that allow you to identify trends within the business enabling you to forecast future events and identify existing trends
Empower your decisions with data with Adapt HRs automated charts & reports, that allow you to identify trends within the business enabling you to forecast future events and identify existing trends
Understand your workforce
Understand your workforce
KPI dashboards help you view and measure important metrics such as headcount, growth, retention, and absenteeism to uncover trends. Adapt allows you to easily create reports for senior staff that demonstrate the outcomes of your HR initiatives over time.
KPI dashboards help you view and measure important metrics such as headcount, growth, retention, and absenteeism to uncover trends. Adapt allows you to easily create reports for senior staff that demonstrate the outcomes of your HR initiatives over time.


Build your workforce with confidence
Sign up now to start simplifying your HR processes

Build your workforce with confidence
Sign up now to start simplifying your HR processes

Build your workforce with confidence
Sign up now to start simplifying your HR processes
Build your workforce with confidence
Sign up now to start simplifying your HR processes
Fast, Modern & Complete HR Platform
Designed for growing businesses
Fast, Modern & Complete HR Platform
Designed for growing businesses
Fast, Modern & Complete HR Platform
Designed for growing businesses